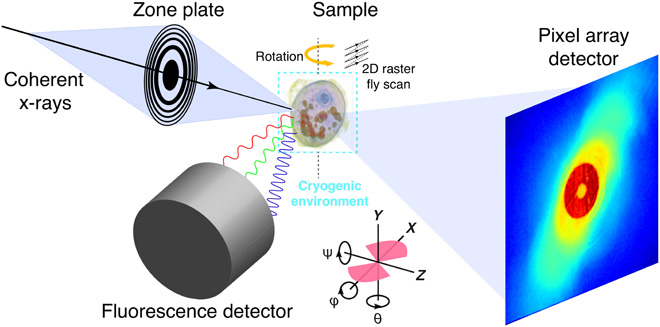
Ptychographic Reconstruction Part
In the traditional way, we use separate methods for ptychographic and fluorescence reconstruction. We consider a ptychography experiment where the observed data \( d_i \) is modeled as:
\[ d_i = |\mathcal{F}(\mathbf{P}_i \mathbf{z})|^2 + \epsilon_i \]
where:
- \(\mathcal{F}\): 2D discrete Fourier transform operator
- \(\mathbf{P}_i\): Probe matrix
- \(z_i\): the object itself which can be written as \(z = x + y_i\)
Reconstruction Problem
The reconstruction loss function is formulated as the following:
\[ \min_{\mathbf{P},\mathbf{z}} \Phi(\mathbf{P},\mathbf{z}) = \frac{1}{2} \sum_{j=1}^{N} \left\| \left| \mathcal{F}(\mathbf{P}_j \mathbf{z})\right| - \sqrt{d_j} \right\|_2^2 \]
X-ray Fluorescence Reconstruction
X-ray fluorescence reconstruct the real part of the image \(x\) using a deconvolution method:
\[ \min_{\mathbf{w},\mathbf{P}} \sum_{e=1}^{N_e} \left\| |\mathbf{P}|^2 \ast \mathbf{w}_e - D_e \right\|_2^2 \]
where \( \mathbf{w} \) represents elemental concentration maps. \(D_e\) corresponds to the experimental flourescence map of element \(e\)
Separate Optimization Framework
Separate optimization of ptychographic and fluorescence reconstruction may lead to the results:
\[ \min_{\mathbf{P},\mathbf{z}} \Phi(\mathbf{P},\mathbf{z}) + \min_{\mathbf{w},\mathbf{P}} \sum_{e=1}^{N_e} \left\| |\mathbf{P}|^2 \ast \mathbf{w}_e - D_e \right\|_2^2 \]
where \( \alpha \) is a scaling parameter balancing between the two objectives.
Joint Optimization Framework
We propose a simultaneous optimization approach:
\[ \min_{\mathbf{w},\mathbf{P},\mathbf{z}} \sum_{e=1}^{N_e} \left\| |\mathbf{P}|^2 \ast \mathbf{w}_e - D_e \right\|_2^2 + \alpha \sum_{j=1}^{N} \left\| \left| \mathcal{F}(\mathbf{P}_j (\sum_e \mathbf{w}_e + i \beta))\right| - \sqrt{d_j} \right\|_2^2 \]
By using joint method, the loss function is consistently less than the original loss function from the separate method
Absorption Coefficient Connection
The absorption coefficient relates to elemental concentrations via:
\[ \mathbf{z} = \delta + i \beta, \quad \delta = \sum_e \mathbf{w}_e \mu_e. \]
Conclusion
This joint framework aims to enhance both ptychographic and fluorescence data processing, leveraging their complementarity for improved reconstruction.
Reference
[1] Deng, J., Vine, D.J., Chen, S. et al. X-ray ptychographic and fluorescence microscopy of frozen-hydrated cells using continuous scanning. Sci Rep 7, 445 (2017). https://doi.org/10.1038/s41598-017-00569-y